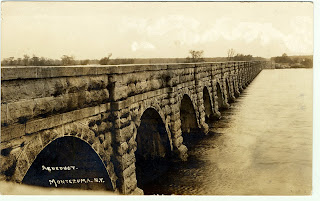
 I took a walk down to the Seneca River Aqueduct today. The river has been running very high due to all the rain, and I wanted to see where the water was today as compared to what historic photos show. I did some study a couple years ago that compared the old aqueduct to the water levels that were measured in 1862 and what they were in 2009. See the string and the sack of gravel? The bit of ribbon above the sack shows what the water level was as measured in 1862. And you can see the ice below. Now if you compare this to a historic photo of the aqueduct,
you can see that the ribbon is about where the water once was. I figure that the river runs a
 bout four feet lower today then it did in 1862, which is a result of the building of the barge canal and all the work that was done in dredging the channel.
The flooding offers us the chance to see where the old shoreline once was, since it has returned the water to its "natural" level. I have studied the old maps, and they show the river as being much different then it is today. Look at how the river bends around the lock. It almost looks like the canal builders dug out the canal and placed the spoils to create the towpath.Bu
 t if you were to go there these days during the summer, you would see that the river is much further from the lock site, tens if not hundreds of feet away.
So today, thanks to the flooding, I was able step back a hundred and fifty years and see where the river once was. And it is striking to see. The river looks just like the map of 1834. I was able to walk out on the Clinton's Ditch towpath, surrounded on both sides by water. The lock site is within feet of the river, and the old canal lock is filled with water, right up to the upper miter sill.
Now realize that I am using one canal to gain an understanding of the other. The Seneca River Aqueduct is from the Enlarged Erie, but the map and the lock site are from the first canal. I have records and photos that show the water level of the river in relation to the aqueduct, so I used the aqueduct to measure and water levels, knowing that the river level was the same from 1834 and 1850. Make sense?
It is difficult to show with photos since all the trees block the view of the water. And t
 he rain was threatening (again!) so the light was flat and not so good to help define water from tree from land. I have included a photo of the old towpath and one of the old lock.
Doing this helps to gain an understanding of what the river once was, and how it shaped our early settlement and growth. If you want my rant about how people are silly to build homes right on the river, thinking that it never floods, well, give me a call.


Studio project concerning redevelopment of the Heritage Park. Helpful blog, but I am seeking annual flooding information. Any ideas?
ReplyDeleteMy email is on right side of this page. Best to get in touch that way. However, a visit to the Army Corps offices, or the Cayuga County Soil and Water offices might help. What I would do is run a map with base level of water and then another with level set at 400. You can get some of this info from the stream gauges. The flood plain map should show where the water would be in times of high water. You can also take the stream gauge info to help predict occurrence and time of year.
ReplyDelete